


IMPORTANT DISCLAIMER: The author(s) of this research hold ‘long’ equity positions in CME, an exchange referenced in this research and would financially benefit from rising share prices. This report is not financial advice or a recommendation to purchase any security or financial product what-so-ever. Please read our terms of service.
First Strike conducted a thorough analysis of over 240,000 data points from CFTC Commitments of Traders (COT) reports across crypto markets. The data showed, and it’s our belief that core market dominance has not been meaningfully impacted by the launch of perpetual futures.
No evidence found of substantial institutional withdraw from incumbent exchanges. After Kalshi launched perpetual futures, COT data showed higher aggregate crypto open interest and stronger dealer participation on CME. No substantial evidence was found which indicated mass institutional migration to perperpetual ‘perp’ futures.
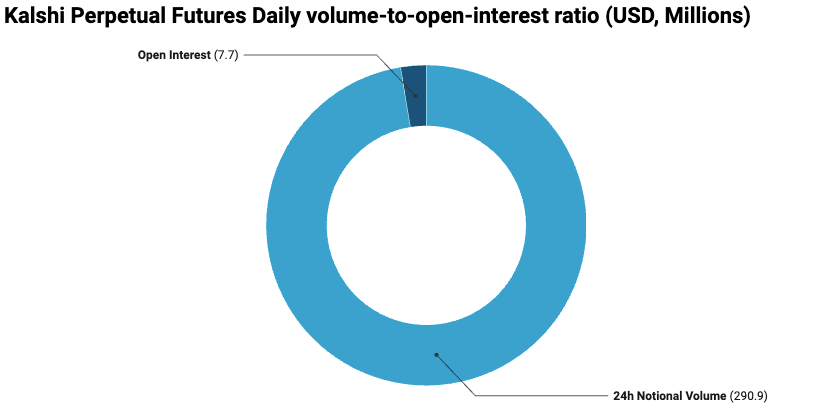
Perpetual futures volume was significant. Reported at $32.67B in June and $41.12B1 in July. First Strike believes (notional) perp volume figures are indicative of high-frequency turnover (37.7x daily Volume to OI ratio on $7.7M BTC daily open interest.)
CME crypto contracts represent only ~80–85 basis points of total enterprise volume and an estimated ~60–65 basis points of total revenue.
Perpetual futures are a viable entrant into capital markets. However, CME equity share pricing of near-term moat erosion remains unfounded based on the post-launch operating evidence contained here-in.
Even for knowledgeable investors, financial exchanges (especially futures) present a challenge to understand on a granular level. To that point, we believe, this was a contributing factor which precipitated the street aggressively selling off CME 0.00%↑ in the prior months. After CME’s Q2 print there was no substantiated fundamental evidence of active moat erosion caused by the launch of perpetual futures on a competitor’s exchange.
CME operates its own clearinghouse which adds another layer of complexity to its financials. This includes margin requirements, collateralization, and default safeguards which can create significant accounting and balance sheet noise that investors must separate from CME’s core earnings power.
CME’s headline metrics utilized to report on overall company health is Average Daily Volume (ADV) and Rate Per Contract (RPC) as they’re not only easy for investors to understand but also provides direct evidence on the strength of CME’s exchange-volume fueled revenue engine.
As theorized above, it is our belief investors need to look past headline numbers to truly understand the intrinsic value and defensive positioning of CME, despite new industry entrants.
Throughout this report, we seek to offer more granular metrics on both CME and their primary domestic perpetual futures exchange competitor while utilizing easy to understand analogies.
Volume is the heart of CME
To fully appreciate CME’s earnings power investors must understand the importance of volume on CME’s exchange network2
Volume is the center of gravity to the strength of CME’s earnings power; it drives transactions and clearing revenue while amplifying their operating leverage.
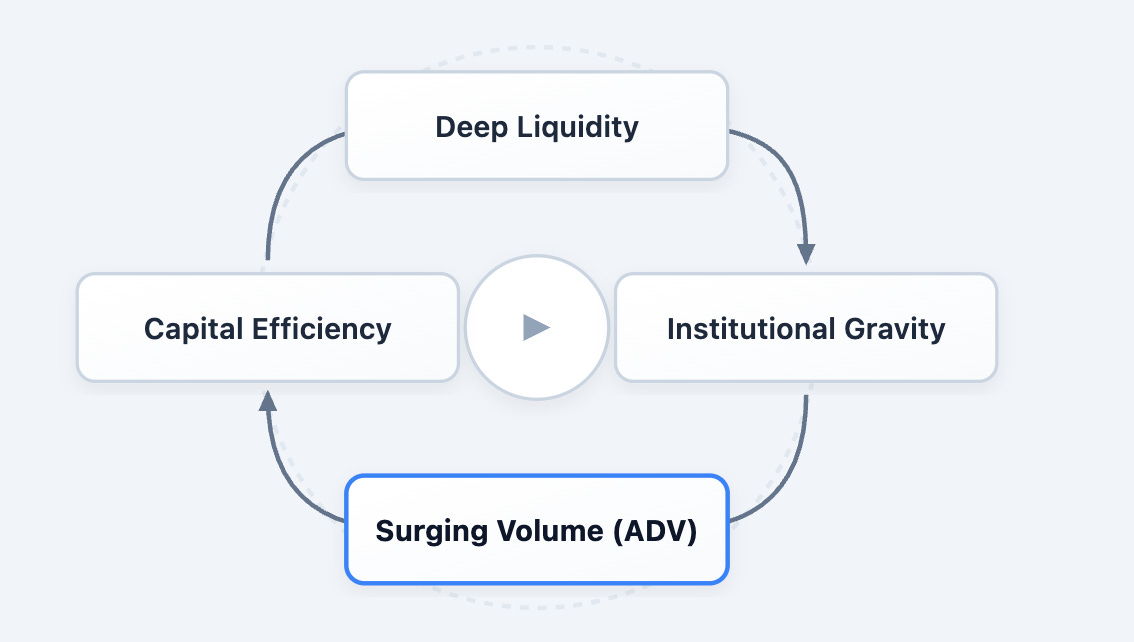
Deep Liquidity
Large tranches of bids/asks stack on the central limit order books (CLOB) this minimizes slippage for institutional traders, all while providing liquidity for other market participants.
Institutional Gravity
A strong center of gravity is formed around the liquidity nexus which keeps institutional traders on the platform.
Surging Volume (ADV)
The flywheel continues with increased participant activity which drives higher Average Daily Volume (ADV) across interest rates, equities, and commodities.
Capital Efficiency
CME’s clearing architecture and cross-margining arrangements continue to enhance capital efficiency by recognizing offsetting risks across eligible products and reducing the collateral required to support those exposures.
All of this taken together creates a self reinforcing flywheel and a strong center of gravity which is increasingly challenging for competitors to displace.
The Litmus Test
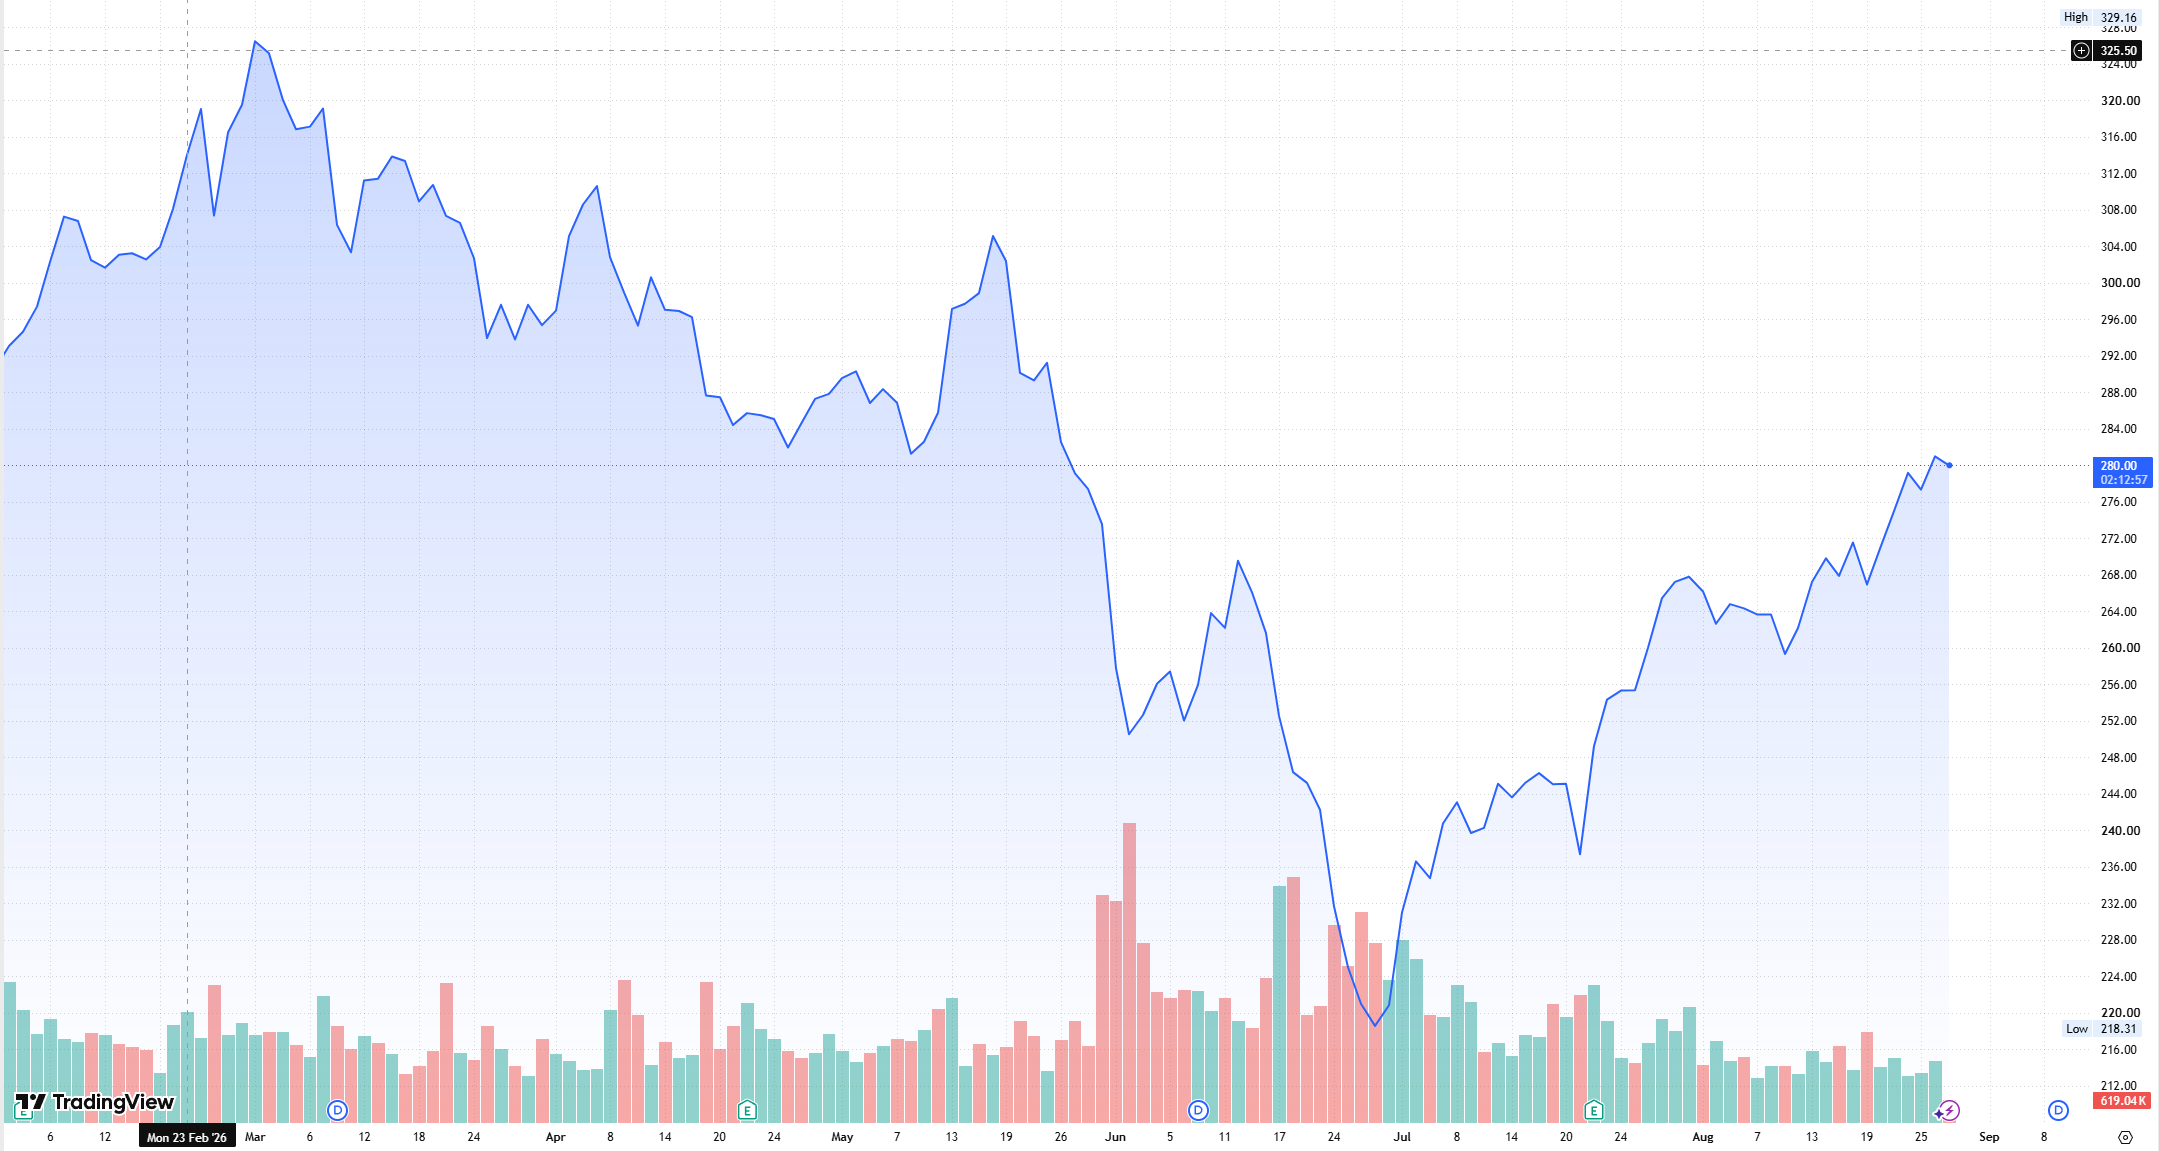
From a peak of $329.16 a share in early March 2026, to a trough of $218 in June 2026 CME shares retreated an alarming 33.68% — as we wrote about in our first article the market severely overreacted to perpetual futures launching on a CFTC-regulated competing exchange.
Our first article was a holistic analysis, now we offer empirical open source CFTC data to further prove CME’s moat was not damaged to the effect the share price reflected in the trailing 5 month period.
For background, the CFTC-COT report is a mosh-pit of data compiled the CFTC which shows a high level overview of the total commitments of traders:
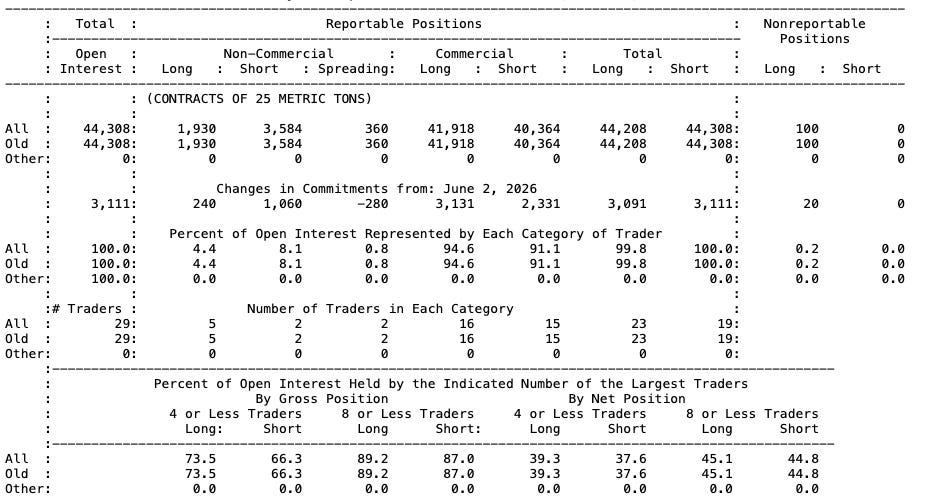
CFTC-COT is taken on Tuesdays and represents a snapshot-in-time of reportable open interest by general trader category and is released on Fridays. Bear in mind, the report does not identify individual firms, but remains a useful public operating indicator for forecasting if CME risk-transfer activity is weakening.
After a lengthy review of the COT data (reported to CFTC) in conjunction with ADV and RPC (reported by CME) we found no substantive evidence showing meaningful migration away from CME Crypto as a result of perpetual future launches on a competing exchange.
As laid out in further detail below—
June 2 2026 was the final COT report before the June 3 2026 perpetual future launch, which we used as our baseline:
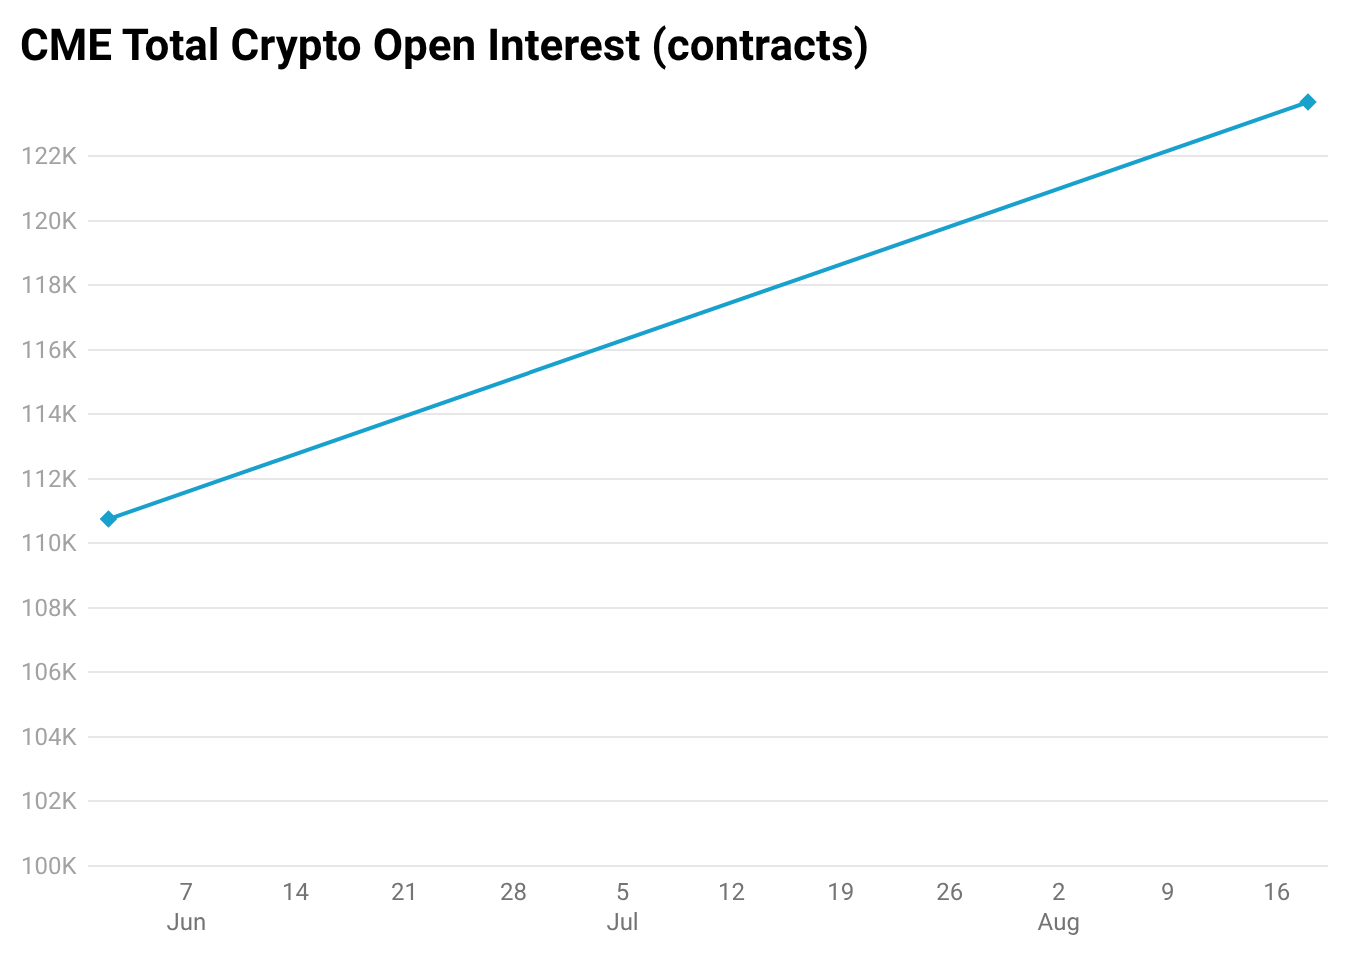
CME total crypto open interest increased from 110,755 contracts to 123,686 contracts by August 18, representing a total increase of 11.7%.
Most importantly, dealer gross open interest increased from 33,583 to 44,808 contracts, representing an increase of 33.4%.

Increased dealer gross positioning on CME is behavior that is consistent with continued activity from liquidity providers (market-makers.)3 The above graph, shows dealer activity has not decreased by any significant margin.
Notwithstanding, asset-manager gross open interest did decline 6.7%, and Ether open interest declined 11.1%. We believe this was asset rotation unrelated to perpetual futures.
A perpetual-futures venue can report high levels of notional volume even when the amount of capital supporting open positions remains small.
With smaller collateral requirements, leverage allows traders to hold large notional exposure to assets such as Bitcoin. Which makes volume measurements alone an incomplete marker of durable, long term capital commitment.
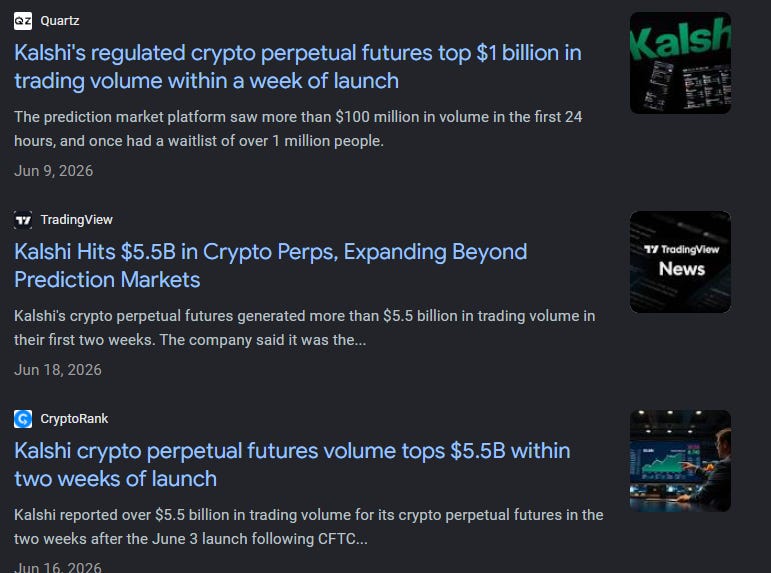
Shown above, and taken at surface level the perpetual futures headline volume metrics are jarring, even more so when investors don’t immediately realize the volumes numbers are notional.
Explained below:
If a perpetual futures trader deposits $1,000 and opens a ‘long’ position at 6x leverage the perpetual futures exchange records that as $6,000 in volume despite the fact that only $1,000 in actual capital was committed.
First week perpetual future volume was substantial, and proved retail traders have an appetite for perpetual futures markets. It should not, however, be treated as a direct threat to CME’s Average Daily Volume, open interest, or revenue.
Turnover ≠ Sustained Open Interest
Volume measures total overall trading activity in a period of time; daily, weekly, monthly and so on. Conversely, Open Interest measures total OUTSTANDING positions which have not been offset/closed.
Imagine a restaurant that serves 1,000 customers a day. That is your volume. 30 minutes before close only 10 tables are occupied. That is open interest: the positions that remain open at that specific point in time.
Bear in mind, just because foot traffic is high does not necessarily mean the restaurant has a large number of diners actively eating. Translate this to perpetual futures: traders may be opening and closing (or liquidated) on positions repeatedly throughout the day; which is very common in ‘perp’ trading. Make no mistake, high volume is a win for DCMs listing perps because it generates transaction revenue.
A restaurant can serve thousands of customers in a day, but if guests are hardly buying anything , then high foot traffic does not translate into a large lift in overall customer spending.
We found that CME’s primary competitor which offers Perpetual Futures has a 37.7x 24-hour volume-to-open interest ratio4 which is indicative of high trading turnover (churn) relative to overall active positions. The high leverage offered by perpetual futures can result in sudden and violent liquidation events for both long/short traders. This contributes to the overall ratio. Anecdotally, this is the basis of institutional aversion to perpetual style futures.
Minimal Direct Earnings Exposure
CME’s crypto products represent approximately 80–85 basis points of total enterprise contract volume in Q2.5
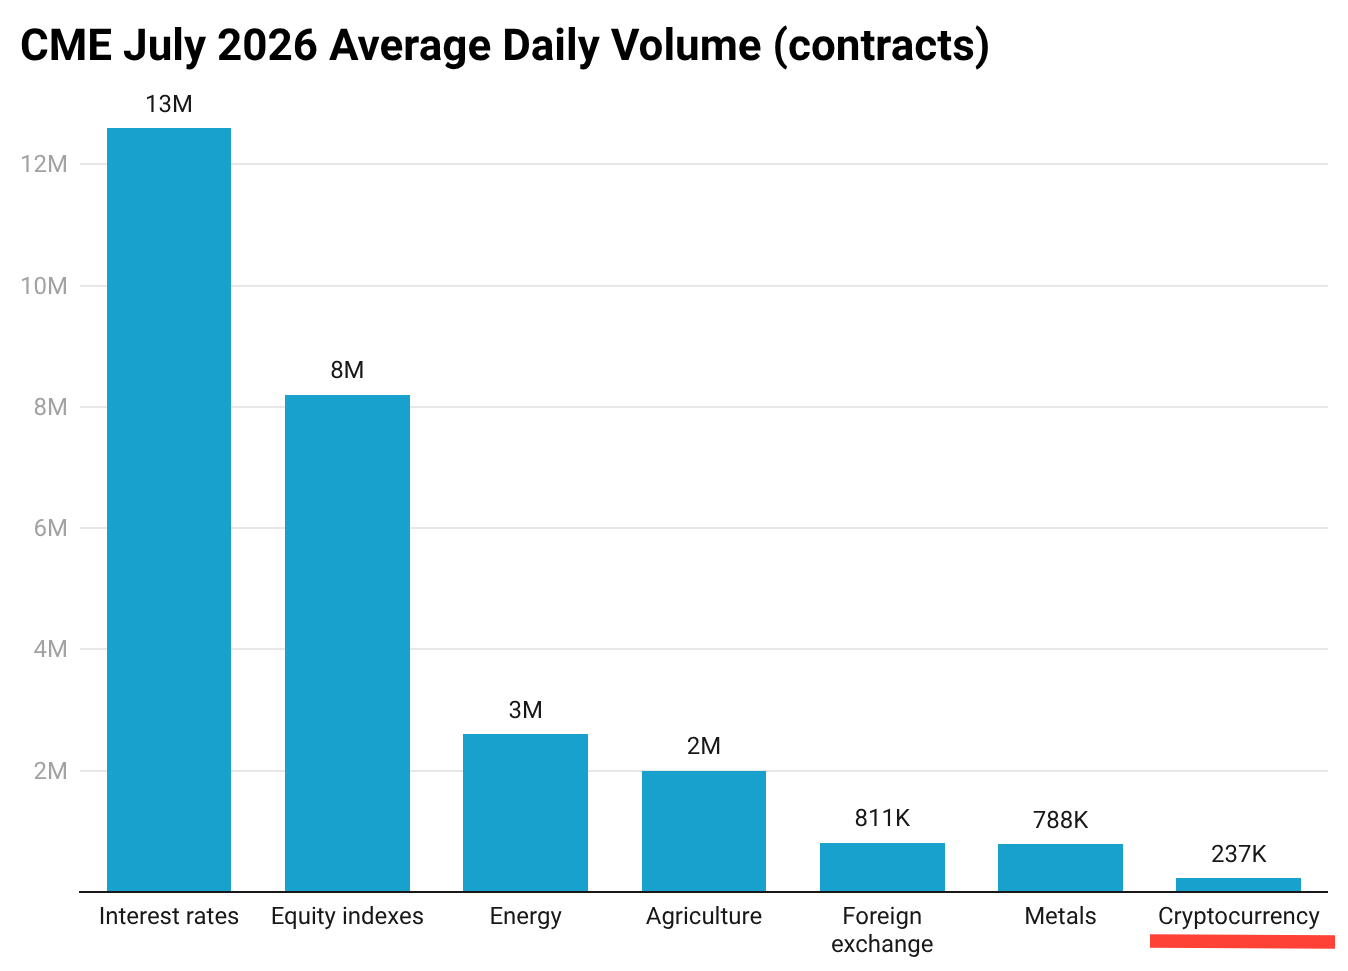
As shown above, cryptocurrency contracts are a very small portion (approx. 80-85bps) of CME’s total enterprise contract volume.
Breaking that down on an estimated revenue per contract basis we surmise CME crypto represents approximately 60-65 bps of overall revenue, on an annual basis. This equates to $40-$45 million in estimated revenue, annually.
Very important to note: this is our own analytical estimate, not a CME-disclosed figure. Actual crypto revenue may differ based on product, customer type, exchange-fee schedule etc.
For arguments sake take a hypothetical scenario where you model CME crypto volume drastically cratering due to mass perpetual futures migration. Even if this hypothetical scenario were to occur, a drastic drawdown in share price as seen in the spring of 2026 is still not mathematically warranted as proven in the Q2 print, and our COT analysis.
There is still risk that competitors utilize crypto perpetual futures as a wedge to start attacking CME’s moat.
However, our anecdotal discussions for background with various institutional futures traders has confirmed our belief that institutional demand for perpetual futures is basically zero.
In summary, and in conjunction with our previous article we still believe the risk of severe displacement to CME’s core operations to be vastly overestimated. COT data taken in light with CME’s own reported ADV growth further sustains our findings. Perpetual futures exchanges are still a credible and legitimate competitive development to CME, however, the market has moved faster than the data.
Both figures are total cumulative volume since launch of perps.
CME is starting to expand its revenue mix with substantial increases in market data revenue which in the past has lagged behind exchange operations and competitors.
COT data does not directly list the underlying purpose of positions.
Volume during period / Standing open Interest at snapshot
CME does not report specific RPC for Crypto, we utilized our own internal models to estimate approximate revenue impact.
This has been a good addition to my portfolio, and a nice way to de-lever on the AI trade.
Your analysis just gets better and better my man, keep up the good work 🤌